See The Math That Makes Real Estate Worth It
Not all properties are created equal. The depreciation a property qualifies for can make a meaningful difference to its tax effects. We'll walk you through how that difference works, so you can see it for yourself.
| Metric | Random | FM 5% | FM 5% + Sonder | FM Heritage |
|---|---|---|---|---|
| Depreciation Method | 2% linear | 5% degressive | 5% deg. + Sonder-AfA | Heritage (3 streams) |
| Year 1 Tax Savings | €5k | €10k | €18k | €13k |
| Years 1-4 Tax Savings | €21k | €41k | €70k | €54k |
| 12-Year Total Tax Savings | €63k | €114k | €143k | €153k |
| Year 1 Monthly Cashflow | €-272 | +€149 | +€752 | +€406 |
Based on your inputs: €450k property, €95,000 income (using progressive tax formula)
What This Comparison Actually Shows
Same property. Same purchase price. Same mortgage. The only difference? How much depreciation the property qualifies for. In this illustration, that difference works out to roughly €50,000-€80,000 in tax effects over 12 years.
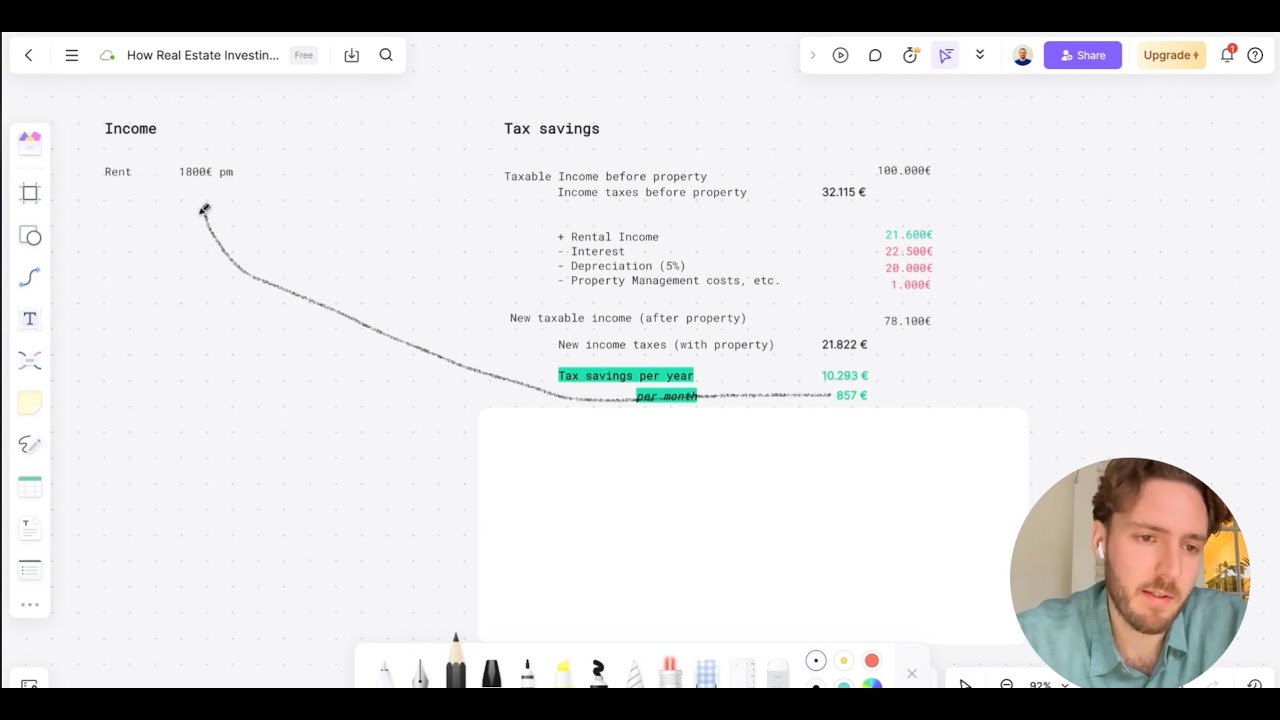
Here's what's happening: an older building with 2% linear depreciation gives you around €6,000/year in tax benefits in this example. Not bad. But a new-build property with 5% degressive depreciation? That jumps to around €10,000/year. Add Sonder-AfA on top (5% + 5% for the first 4 years), and in this example you could be looking at around €15,000-€18,000 in annual tax effects in the early years.
Heritage properties take this even further with three concurrent depreciation streams running simultaneously. In this example, that can mean around €20,000-€25,000 in tax effects in year one alone.
But here's where it gets real: Look at the monthly cashflow row. A property with 2% AfA might be cashflow-neutral or slightly negative. The same property with higher depreciation? Cashflow can turn positive earlier. The tax effects can turn a monthly loss into a monthly gain, while you're building equity the entire time.
This isn't just about year one. Those tax effects add up over 12 years. The difference between a basic property and a heritage property, in this illustration? Roughly €70,000-€80,000 in tax effects alone. That's before accounting for the cashflow picture, the faster equity buildup, and the fact that you can sell tax-free after 10 years thanks to Germany's Spekulationsfrist.
These figures are illustrative and based on general assumptions. They do not constitute tax or financial advice. Individual results depend on your personal circumstances. Consult a licensed tax advisor (Steuerberater) for advice specific to your situation.
Watch: How Tax Benefits Actually Work
See a step-by-step walkthrough of how depreciation turns tax payments into equity, and why the property you choose makes such a massive difference.
Why Most Properties Don't Qualify
The math works beautifully, but finding properties that qualify for maximum depreciation is the hard part. Most properties on the market are older buildings stuck at 2% linear depreciation. New construction with 5% degressive is rare. Properties eligible for Sonder-AfA? Even rarer. Heritage properties with proper documentation? Unicorns.
This is where Financemate comes in. Our property partner maintains a portfolio of properties that qualify for depreciation benefits. Every property in that portfolio is vetted for its tax characteristics, not basic 2% properties. That's why the comparison above isn't theoretical. It's the difference between what you'd find at random and what our property partner presents.
📚 Want to understand the math deeper?
- • Read our Tax Strategy Guide for the complete breakdown of how depreciation works
- • Check our Real Estate Glossary for definitions of all terms
- • Use our Property Investment Simulator to see your exact numbers with your income
Disclaimer: This comparison is for educational purposes only and does not constitute financial, tax, or legal advice. Actual results vary based on individual circumstances, property specifics, tax situations, and market conditions. Consult with qualified tax advisors and financial professionals before making investment decisions. Past performance and projections are not guarantees of future results.